The event log
Everything that happened, in order, with its payload. This is the session's .jsonl
rendered as a table — nothing summarised, nothing dropped.
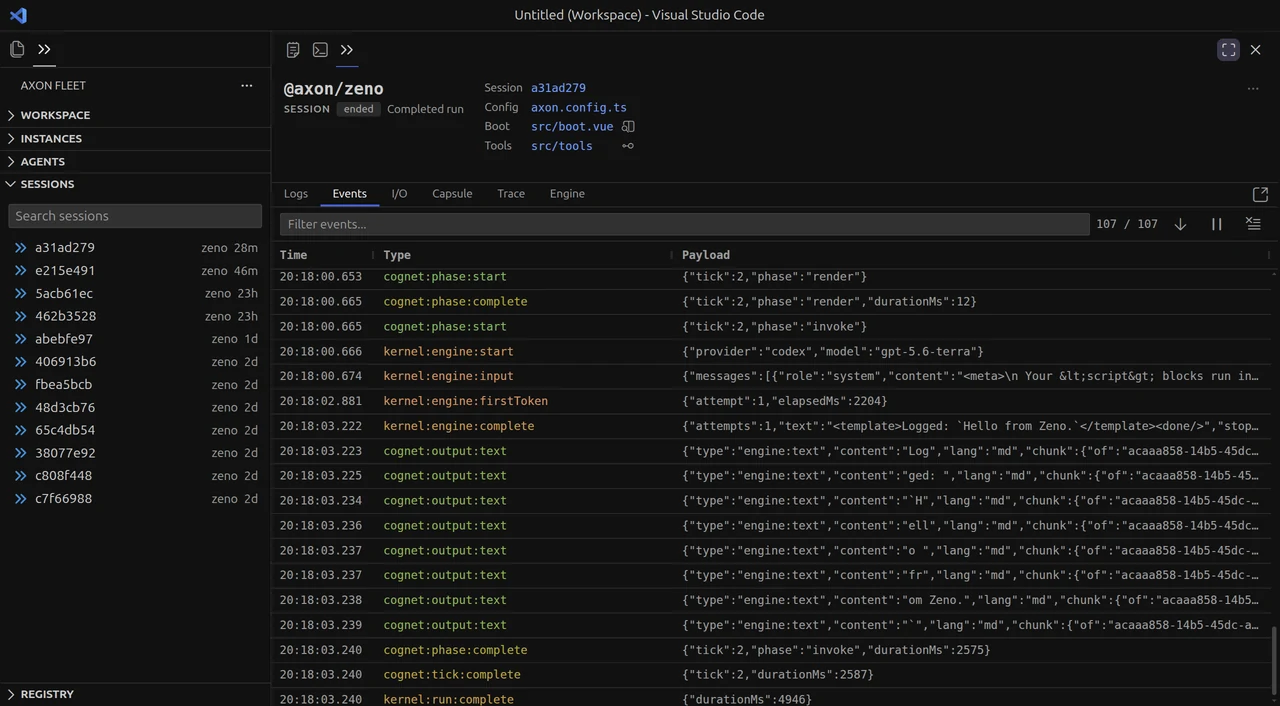
Three columns: the millisecond time, the event type, and its payload. The counter reads matched / total, so a filter tells you how much of the run you are looking at rather than silently hiding the rest.
Reading a run
The types are namespaced, and the namespace tells you which layer emitted it:
build: | Resolving and preparing the agent |
kernel: | The runtime's meter around engine calls, tools and the loop |
cognet: | The brain narrating itself — ticks, phases, output |
capsule: | The sandbox — commands, processes, policy decisions |
module: | Capabilities loading and setting up |
axon: | The conversation, and the agent's own lifecycle |
A single turn reads as a recognisable sequence. cognet:phase:start opens a phase,
kernel:engine:start names the provider and model, kernel:engine:input carries the
messages actually sent, kernel:engine:firstToken is when the model started answering,
and kernel:engine:complete brings back the text with its stop reason and attempt count.
Between the last two you will see cognet:output:text repeatedly — those are streamed
chunks, which is what a response looks like while it is still arriving.
The three worth knowing by name:
axon:agent:message — what it actually said.
capsule:stdin / capsule:stdout — what it ran, and what came back.
Every type is documented in events.
The filter
Type anything and the stream narrows live — a namespace to watch one layer, a type to follow one operation, a value from a payload to find the run that touched it.
The toolbar beside it controls the tail: follow the newest events as they land, pause to read without the list moving under you, or clear what has accumulated.
Why the payloads are raw
They are the committed values, not a rendering of them. durationMs is the number the
runtime recorded, configHash is the hash it computed, and a truncated payload is
truncated in the display only.
That matters when the bug is a value being wrong rather than a step being missing — the kind of thing a prettier view would have quietly formatted away.
Next: Trace — the same events, laid against time.