The console
Click anything — an agent, a live instance, a finished session — and the console opens on it. The top half is what you selected. The bottom half is six ways of reading it.
The subject
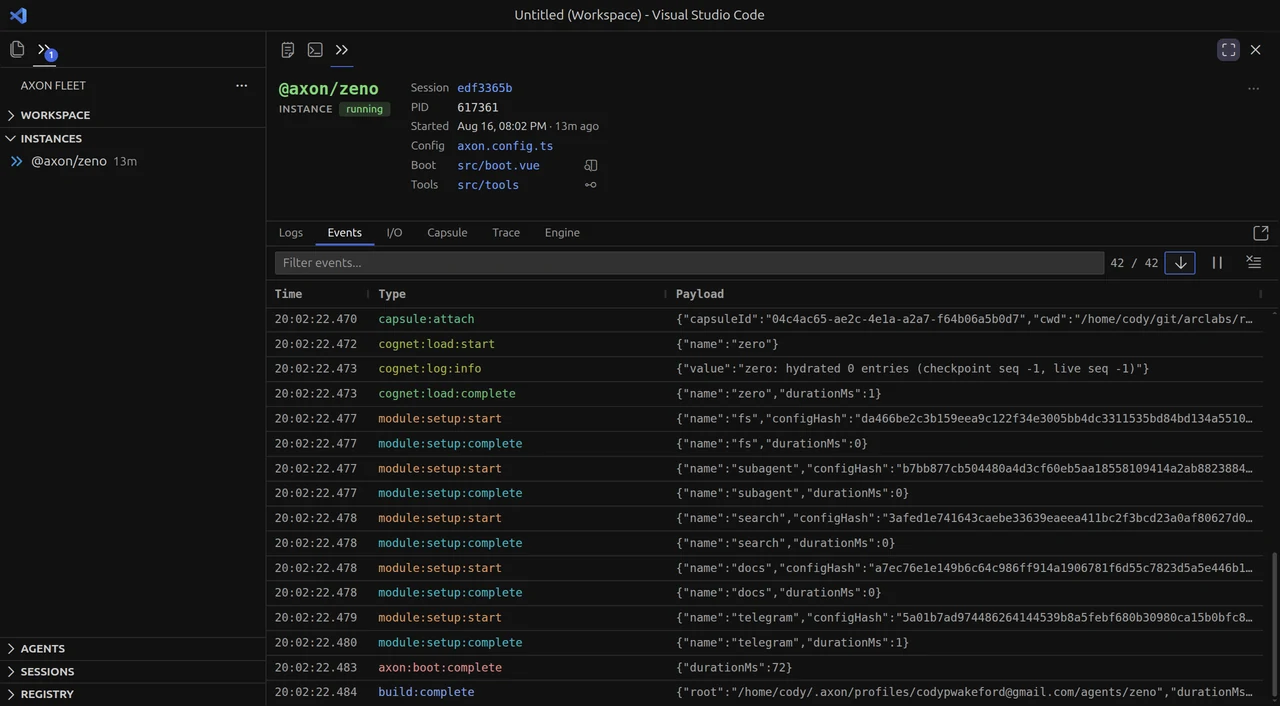
The header names what you are looking at and links into it.
| Session | The .jsonl this run is writing, or wrote |
| PID · Started | Live instances only — the process and its uptime |
| Config | axon.config.ts, as it was booted |
| Boot | src/boot.vue, with an action to render it as the model saw it |
| Tools | src/tools, with an action to open the generated tool scope |
A badge says which kind of subject it is: running for a live instance, ended for a finished session. The fields shift with it — a session has no pid, because there is no process left to name.
Those links matter more than they look. When a run goes wrong, the next question is almost always what was this agent configured with? — and the answer is one click from the thing that went wrong, rather than a hunt through the file tree.
Six panes
| Pane | Reads |
|---|---|
| Logs | What the process wrote, as a terminal would show it |
| Events | Everything that happened, in order |
| I/O | The sensory timeline — stimuli in, output and actions out |
| Capsule | What ran in the sandbox, and what policy allowed |
| Trace | The same run laid against time |
| Engine | What the model actually received |
They are not summaries. Each is the session's .jsonl read a different way, which is why
none of them can disagree with another.
Live and finished are one interface
Every pane reads from a source — a running instance, or a session file on disk. That is the whole difference, and it is invisible in the panes themselves.
A finished session is not a lesser view. It is the same file the live view was tailing, which stopped appending. A run you missed is as debuggable as one you were watching, which means reproducing a bug is never a prerequisite for looking at it.
It works for any agent
The panes read kernel:* telemetry — the runtime's own meter around every engine call,
tool and command. Nothing from inside a cognet.
So a custom cognet gets the same Trace and the same Engine view as a stock one, and never has to know a debugger exists.
Events — what happened. I/O — what it was receiving. Trace — where the time went. Engine — why it did that.